2020 is only five months old, but in many ways it is one of the most historic years we’ve ever seen. “2020 went from moving along nicely, to seeing the worst recession in a generation and the fastest bear market ever,” explained LPL Financial Senior Market Strategist Ryan Detrick. “Now stocks are in the midst of one of the best bull runs ever, even though the economy remains extremely weak, thanks to record stimulus and hopes over a vaccine.”
To best sum it all up, here are 10 charts that tell the picture of 2020 so far.
1.) The 2010s were the first decade in history to go all 10 years without a recession, which of course ended just months into the new decade, as the economy stopped. Stocks gained 13.5% on an annual basis last decade, surprisingly, only the third-best decade over the past four.
2.) This is an election year, and the S&P 500 Index hasn’t been lower when a President is up for reelection since FDR in 1940. Although this seemed nearly impossible at the March lows, it is looking like this incredible streak could have a chance in 2020.
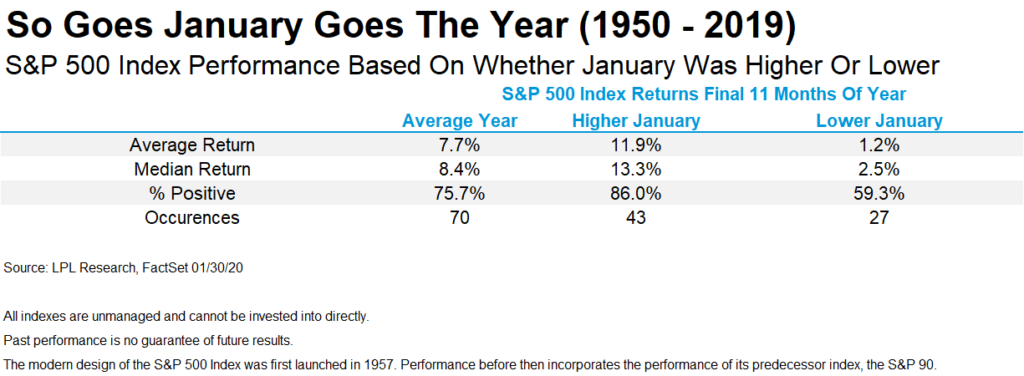
3.) One of the first signs something could go wrong in 2020 was stocks fell in January. Historically, this has meant potential trouble for the final 11 months.
4.) As fears over COVID-19 gripped the world, the Dow Jones Industrial Average had its fastest bear market ever, in only 19 days. To put this in perspective, this was the fastest bear market in the 124-year history of the Dow.
5.) Mark Twain said “History doesn’t repeat itself, but it often rhymes”. Looking at history, every 50 years there has been a terrible pandemic and stocks fell more than 30%. We don’t know if the ultimate lows are in this time, but so far, history is rhyming.
6.) More than 20 million people in the US lost their jobs in April, while the unemployment rate soared to near 15%, the highest since the Great Depression. Record drops in manufacturing, industrial production, retail sales, and consumer spending have all taken place in the past two months as well.
7.) A recession is here, ending the streak of 128 months in a row without one. What is unique about the previous expansion was nominal gross domestic product (GDP) grew only 50%, about the average growth seen during the previous expansions, but this expansion was nearly twice as long as the average expansion (10 years versus 5 years).
8.) The bounce off of the March 23 S&P 500 lows has been historic in many ways. In fact, it was one of the best 20-day rallies ever, with previous best rallies seeing strong returns 6 and 12 months later.
9.) As scary as it was on the way down, stocks have come roaring back, gaining more than 35% from the March 23 lows. This would classify as the greatest bear market bounce ever, which opens the question: is this more than a bear market bounce and instead the start of a new bull market?
10.) The number of COVID-19 tests in the US nearly doubled in May versus what was seen in April. Additionally, fewer and fewer tests are coming back positive. Testing is one of the key ways we will beat this and this is a step in the right direction. We’ve also seen new monthly lows in people on ventilators, in the ICU, and in hospitals.
Hard to believe, but there are still 7 months left in 2020. It hasn’t been easy for any of us, and we continue to keep everyone impacted by this pandemic in mind, but we continue to see the glass as half full. The dual benefit of record monetary and fiscal policy should help create a bridge to help those most impacted, while the economy can slowly come back online later this year.
IMPORTANT DISCLOSURES
This material is for general information only and is not intended to provide specific advice or recommendations for any individual. There is no assurance that the views or strategies discussed are suitable for all investors or will yield positive outcomes. Investing involves risks including possible loss of principal. Any economic forecasts set forth may not develop as predicted and are subject to change.
References to markets, asset classes, and sectors are generally regarding the corresponding market index. Indexes are unmanaged statistical composites and cannot be invested into directly. Index performance is not indicative of the performance of any investment and do not reflect fees, expenses, or sales charges. All performance referenced is historical and is no guarantee of future results.
Any company names noted herein are for educational purposes only and not an indication of trading intent or a solicitation of their products or services. LPL Financial doesn’t provide research on individual equities. All information is believed to be from reliable sources; however, LPL Financial makes no representation as to its completeness or accuracy.
This Research material was prepared by LPL Financial, LLC.
Securities and advisory services offered through LPL Financial (LPL), a registered investment advisor and broker-dealer (member FINRA/SIPC).
Insurance products are offered through LPL or its licensed affiliates. To the extent you are receiving investment advice from a separately registered independent investment advisor that is not an LPL affiliate, please note LPL makes no representation with respect to such entity.
- Not Insured by FDIC/NCUA or Any Other Government Agency
- Not Bank/Credit Union Guaranteed
- Not Bank/Credit Union Deposits or Obligations
- May Lose Value


